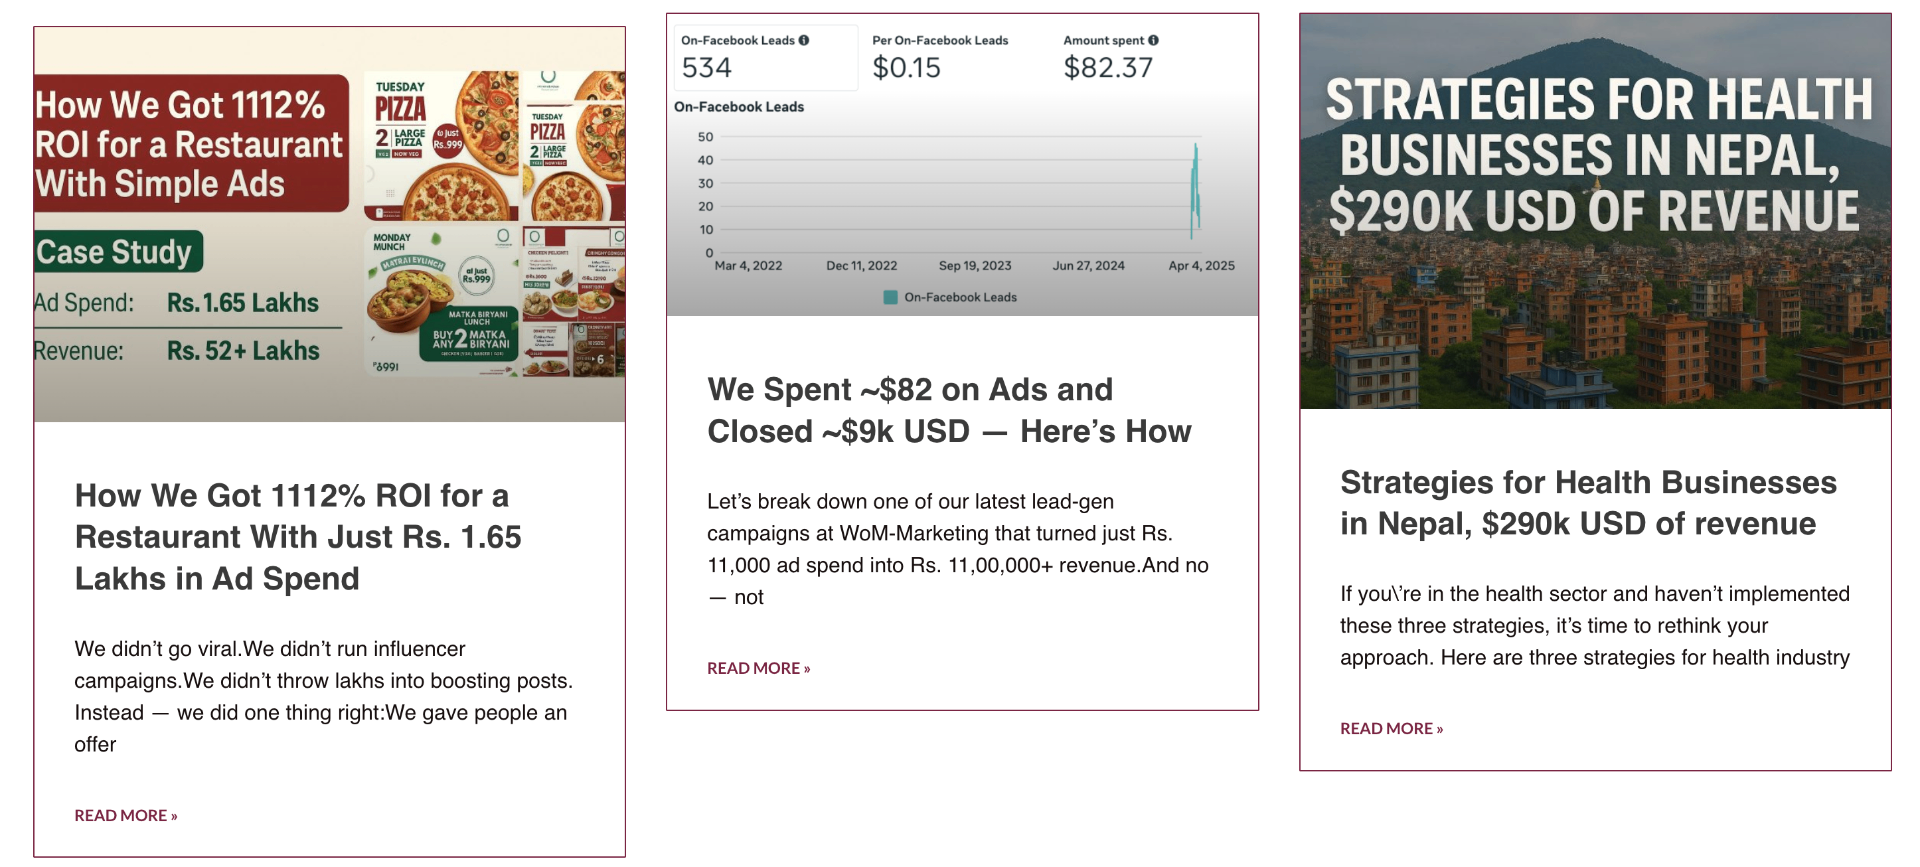
Why this case study needed a clearer explanation
This is a historical Brand Bird restaurant campaign note. The client is not named because the commercial work was confidential, and the figures below come from the campaign summary rather than an independent financial audit.
That distinction matters. A case study should help an operator understand the decisions and evidence, not turn one result into a universal promise.
The business question
The campaign was designed to produce measurable local demand over a 90-day period. The operating notes record three practical gaps before launch:
- No reliable path from an ad to an order
- Inconsistent food creative and offer presentation
- No regular review rhythm for deciding what to stop or continue
The work therefore covered more than ad targeting. It connected the menu, creative, local audience, ordering path and weekly campaign review.
What changed
1. A clearer conversion path
The team used a simple menu and WhatsApp ordering path so an interested person had an obvious next step. Campaign reporting is only useful when the business can connect attention to an enquiry or order.
2. Product-led creative
The campaign used photos and short videos of the dishes and preparation process. The creative focused on the offer and food rather than generic restaurant branding.
3. Local delivery
The audience was kept close to the restaurant's service area. Local relevance, delivery range and the ability to fulfil an order were considered together instead of treating reach as the goal.
4. Weekly decisions
Underperforming ads were paused, stronger creatives received more budget and new variations were tested. This created a repeatable learning loop instead of leaving one boosted post running indefinitely.
The recorded campaign figures
The revenue-to-ad-spend ratio is calculated as 52 divided by 1.65. It is not the same as profit or ROI. A defensible ROI calculation would also need food cost, discounts, delivery cost, staff cost, refunds and the agreed attribution method.
An older campaign graphic used the label “1112% ROI”; that percentage does not reconcile with the spend and revenue figures under the standard ROI or ROAS formulas, so this page does not repeat it as a verified metric.
What the numbers do not prove
- They do not show how much revenue was incremental rather than existing demand
- They do not show profit after restaurant operating costs
- They do not isolate the contribution of each creative or audience
- They do not guarantee another restaurant will reproduce the result
The useful lesson for a Nepal restaurant
Start with the order path and fulfilment reality. Then test the offer, creative and local audience while recording outcomes consistently. The strongest result is not a screenshot alone; it is a process the business can review and improve.
For the consulting method behind this review, see Meta Ads consulting in Nepal. If you want to discuss a specific campaign, share the business context.